Safari Top, Part 2
I posted recently about getting the top memory-using tabs from Safari. This is the sort of pickle you get into if you're using a laptop with only 8GB of RAM. There are two problems: (1) how to map tabs to process ids and (2) how to get the memory usage of the underlying processes.
Once you enable defaults write com.apple.Safari IncludeInternalDebugMenu 1
AppleScript works well enough to get the mapping of tabs to process ids, but,
crucially for the second problem, ps -o pid,rss was underreporting memory
usage. For example, Claude is reportedly using 1GB of memory, but ps is
reporting just 1MB.
$ps -o rss 49296
RSS
1056

This led me down a rabbit hole of finding the vmmap command, and seeing
memory usage more in the 1GB ballpark.
$vmmap --summary 49296 | tail -n 10
                                          VIRTUAL   RESIDENT      DIRTY    SWAPPED ALLOCATION      BYTES DIRTY+SWAP          REGION
MALLOC ZONE                                  SIZE       SIZE       SIZE       SIZE      COUNT  ALLOCATED  FRAG SIZE  % FRAG   COUNT
===========                               =======  =========  =========  =========  =========  =========  =========  ======  ======
WebKit Malloc_0x10980e5f8                    2.4G         0K         0K     829.8M    5389219     853.3M         0K      0%      56
DefaultMallocZone_0x104f8c000               48.5M         0K         0K      10.3M      31551      8420K      2156K     21%     532
QuartzCore_0x105110000                        16K         0K         0K         0K          0         0K         0K      0%       1
DefaultPurgeableMallocZone_0x152268000         0K         0K         0K         0K          0         0K         0K      0%       0
===========                               =======  =========  =========  =========  =========  =========  =========  ======  ======
TOTAL                                        2.4G         0K         0K     840.1M    5420770     861.5M         0K      0%     589
I learned about vmmap from Julia Evans' blog
post and went on a little
bit of a detour to try to replicate it. It turns out that to get a "mach port"
you need several "Entitlements" like com.apple.security.get-task-allow and
com.apple.security.cs.debugger. So, you make the Rust work, figure out how to
codesign -v -s "..." --entitlements src/entitlements.plist target/debug/foo
and, voila, it still doesn't work. Safari is protected by System Integrity Protection
and doesn't allow you to open a mach port to it.
So, back at square two, we find out about proc_pidinfo(), find the header
files in
/Library/Developer/CommandLineTools/SDKs/MacOSX13.3.sdk/usr/include/libproc.h,
and use Python's ctypes package. The ri_phys_footprint field seems to match
with Activity Monitor says. (The
documentation
is sparse, and I haven't delved deeper.) The reason to use Python ctypes rather than compiling a binary is to avoid
a compile or installation step.
So, here's the result:
$./safari-top.py  | head -n 2
911.4MB 4520 Insightful Question - Claude [WP 4520] https://claude.ai/chat/XXXXXXXX-XXXX-XXXX-XXXX-XXXXXXXXXXX0
803.5MB 49296 Boring Question - Claude [WP 49296] https://claude.ai/chat/XXXXXXXX-XXXX-XXXX-XXXX-XXXXXXXXXXX1
Here's the Python code:
#!/usr/bin/env python3
import ctypes
import re
import ctypes.util
import subprocess
import json

# Shows Safari tabs with their memory usage, sorted largest descending.
#
# Enable Safari's debug menu with
#   defaults write com.apple.Safari IncludeInternalDebugMenu 1
# Enable showing pid in tab titles by choosing
#   Debug...Miscellaneous Flags...Show Web Process IDs in Page Titles
#
# License: MIT

def main():
    data = [(usage(pid), pid, title, url) for title, url, pid in tabs_and_pids()]
    data.sort(reverse=True)
    for mem, pid, title, url in data:
        print(human_readable_size(mem), pid, title, url)


TAB_TITLES_AND_URLS_SCRIPT = """
	function run() {
			const ret = [];
			const Safari = Application('Safari');
			const windows = Safari.windows();
			for (let windowIndex = 0; windowIndex < windows.length; windowIndex++) {
					const tabs = windows[windowIndex].tabs();
									if (tabs === null) {
										continue;
									}
					for (let tabIndex = 0; tabIndex < tabs.length; tabIndex++) {
							const currentTab = tabs[tabIndex];
							const tabName = currentTab.name();
							const tabURL = currentTab.url();
							ret.push([tabName, tabURL]);
					}
			}
			return JSON.stringify(ret);
	}
"""


def tabs_and_pids():
    result = subprocess.check_output(
        ["osascript", "-l", "JavaScript", "-e", TAB_TITLES_AND_URLS_SCRIPT],
        shell=False,
        text=True,
    )
    for title, url in json.loads(result):
        pid = re.search(r"\[WP\s*(\d+)\]", title).group(1)
        yield title, url, int(pid)


def human_readable_size(size_bytes):
    units = ["B", "KB", "MB", "GB"]
    size = float(size_bytes)
    unit_index = 0

    while size >= 1024 and unit_index < len(units) - 1:
        size /= 1024
        unit_index += 1

    return f"{size:.1f}{units[unit_index]}"


# See /Library/Developer/CommandLineTools/SDKs/MacOSX13.3.sdk/usr/include/libproc.h
# and System/Library/Frameworks/Kernel.framework/Versions/A/Headers/sys/resource.h
RUSAGE_INFO_V6 = 6


class rusage_info_v6(ctypes.Structure):
    _fields_ = [
        ("ri_uuid", ctypes.c_uint8 * 16),
        ("ri_user_time", ctypes.c_uint64),
        ("ri_system_time", ctypes.c_uint64),
        ("ri_pkg_idle_wkups", ctypes.c_uint64),
        ("ri_interrupt_wkups", ctypes.c_uint64),
        ("ri_pageins", ctypes.c_uint64),
        ("ri_wired_size", ctypes.c_uint64),
        ("ri_resident_size", ctypes.c_uint64),
        ("ri_phys_footprint", ctypes.c_uint64),
        ("ri_proc_start_abstime", ctypes.c_uint64),
        ("ri_proc_exit_abstime", ctypes.c_uint64),
        ("ri_child_user_time", ctypes.c_uint64),
        ("ri_child_system_time", ctypes.c_uint64),
        ("ri_child_pkg_idle_wkups", ctypes.c_uint64),
        ("ri_child_interrupt_wkups", ctypes.c_uint64),
        ("ri_child_pageins", ctypes.c_uint64),
        ("ri_child_elapsed_abstime", ctypes.c_uint64),
        ("ri_diskio_bytesread", ctypes.c_uint64),
        ("ri_diskio_byteswritten", ctypes.c_uint64),
        ("ri_cpu_time_qos_default", ctypes.c_uint64),
        ("ri_cpu_time_qos_maintenance", ctypes.c_uint64),
        ("ri_cpu_time_qos_background", ctypes.c_uint64),
        ("ri_cpu_time_qos_utility", ctypes.c_uint64),
        ("ri_cpu_time_qos_legacy", ctypes.c_uint64),
        ("ri_cpu_time_qos_user_initiated", ctypes.c_uint64),
        ("ri_cpu_time_qos_user_interactive", ctypes.c_uint64),
        ("ri_billed_system_time", ctypes.c_uint64),
        ("ri_serviced_system_time", ctypes.c_uint64),
        ("ri_logical_writes", ctypes.c_uint64),
        ("ri_lifetime_max_phys_footprint", ctypes.c_uint64),
        ("ri_instructions", ctypes.c_uint64),
        ("ri_cycles", ctypes.c_uint64),
        ("ri_billed_energy", ctypes.c_uint64),
        ("ri_serviced_energy", ctypes.c_uint64),
        ("ri_interval_max_phys_footprint", ctypes.c_uint64),
        ("ri_runnable_time", ctypes.c_uint64),
        ("ri_flags", ctypes.c_uint64),
        ("ri_user_ptime", ctypes.c_uint64),
        ("ri_system_ptime", ctypes.c_uint64),
        ("ri_pinstructions", ctypes.c_uint64),
        ("ri_pcycles", ctypes.c_uint64),
        ("ri_energy_nj", ctypes.c_uint64),
        ("ri_penergy_nj", ctypes.c_uint64),
        ("ri_reserved", ctypes.c_uint64 * 14),
    ]


proc_lib = ctypes.CDLL(ctypes.util.find_library("proc"))
proc_pid_rusage = proc_lib.proc_pid_rusage
proc_pid_rusage.argtypes = [ctypes.c_int, ctypes.c_int, ctypes.POINTER(rusage_info_v6)]
proc_pid_rusage.restype = ctypes.c_int


def usage(pid):
    us = rusage_info_v6()
    proc_pid_rusage(ctypes.c_int(pid), RUSAGE_INFO_V6, ctypes.byref(us))
    return us.ri_phys_footprint


if __name__ == "__main__":
    main()
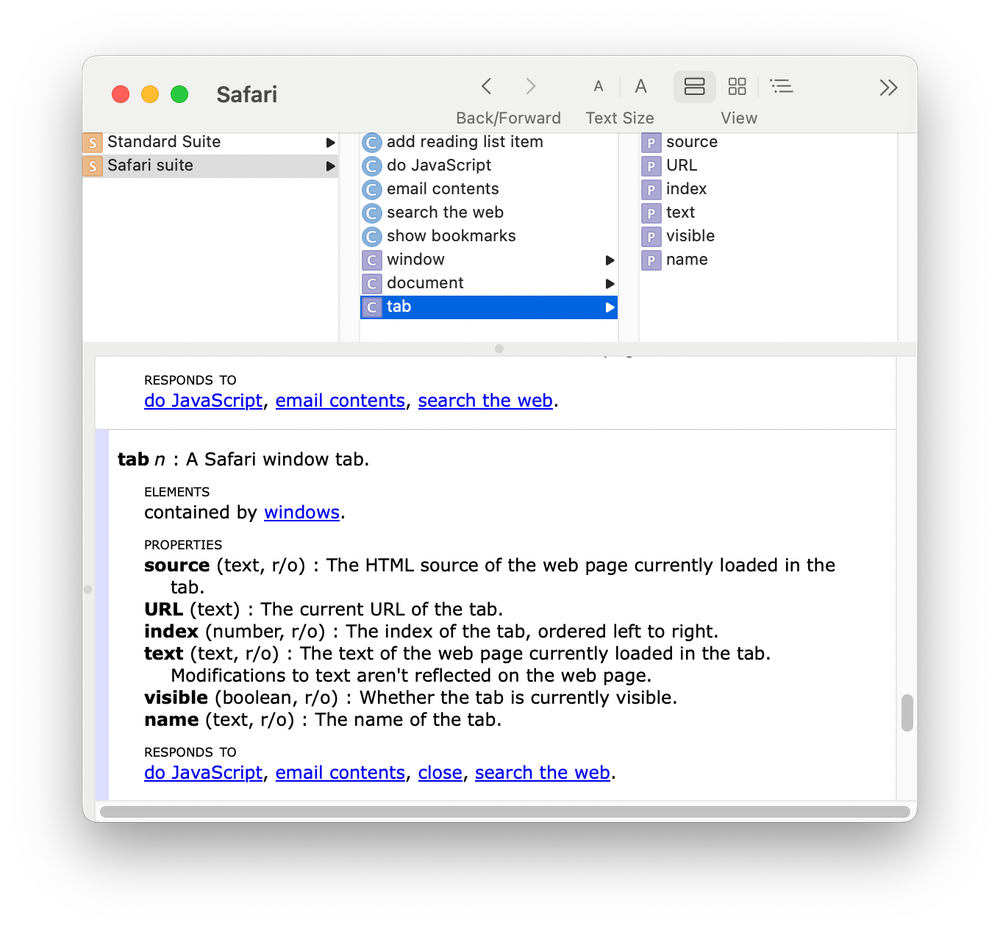
This time, I converted the AppleScript into "Javascript for Automation" (JXA), and learned that the Script Editor app has an "Open Dictionary" feature which lets you browse what's possible.

If you find out how Activity Monitor actually gets the pids of the tabs, let me know!